Sections

Spatial + textual learning for charts

STARTSpatial and Textual Learning for Chart Understanding

Zhuoming Liu1, Xiaofeng Gao2, Feiyang Niu2, Qiaozi Gao2, Liu Liu3, Robinson Piramuthu2

1 University of Wisconsin–Madison
2 Amazon AGI   3 MIT

Learning to understand both the visual structure of a chart and the data behind it.

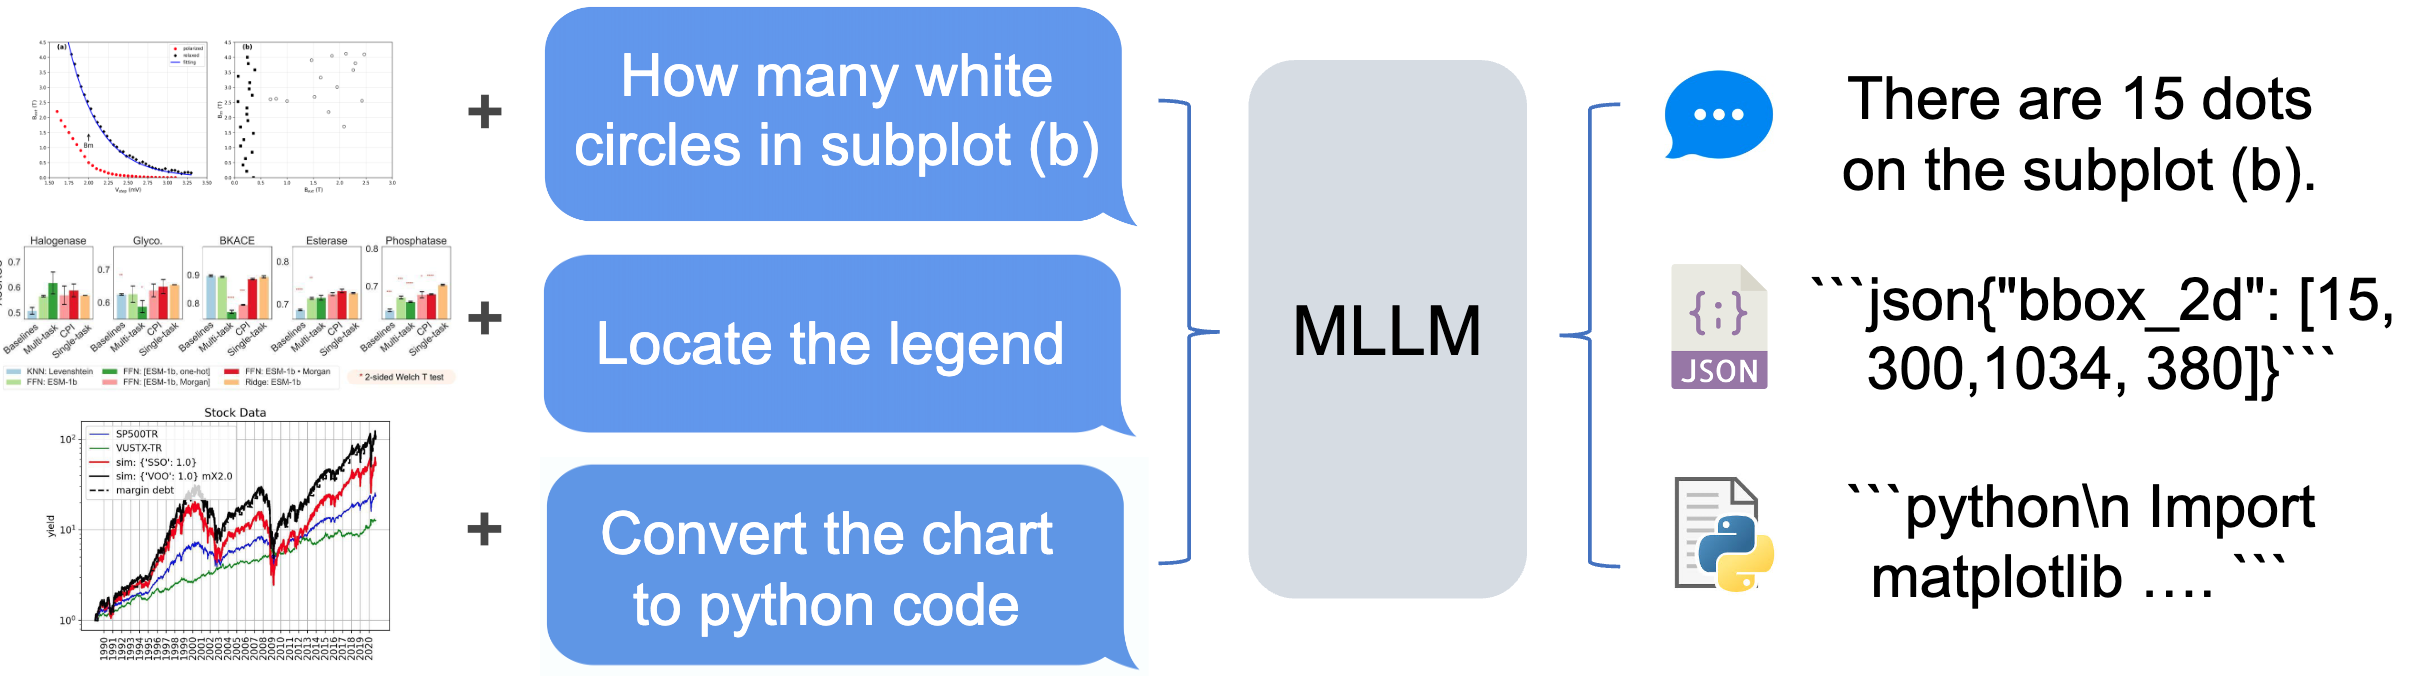
START trains a multimodal model to answer chart questions, localize chart elements as coordinates, and reconstruct charts as Python code.
One chart, complementary learning signals. Answer questions, ground visual elements, and recover executable chart code.

01 / Motivation

Introduction

Reading a chart means understanding where things are and what they represent.

Charts combine a structured visual layout with an underlying data representation. A model must locate the right subplot, axis, or legend before it can reliably interpret the values and answer a question. START brings these two properties into training through chart-element grounding and chart-to-code generation, alongside chart question answering.

We introduce START-Dataset to support this learning and CS-Bench to evaluate how well models understand chart structure. This page highlights the publicly released, reproduced dataset, benchmark, and checkpoint.

The data

Learn from structure

Chart images paired with code, element locations, and question-answer supervision.

The benchmark

Evaluate spatial understanding

Direct grounding and question answering that requires locating chart elements.

The model

Connect layout and meaning

Spatial and textual learning improves the released Qwen2.5-VL-7B checkpoint.

02 / Training resource

START-Dataset

Real chart complexity. Executable code. Spatial supervision.

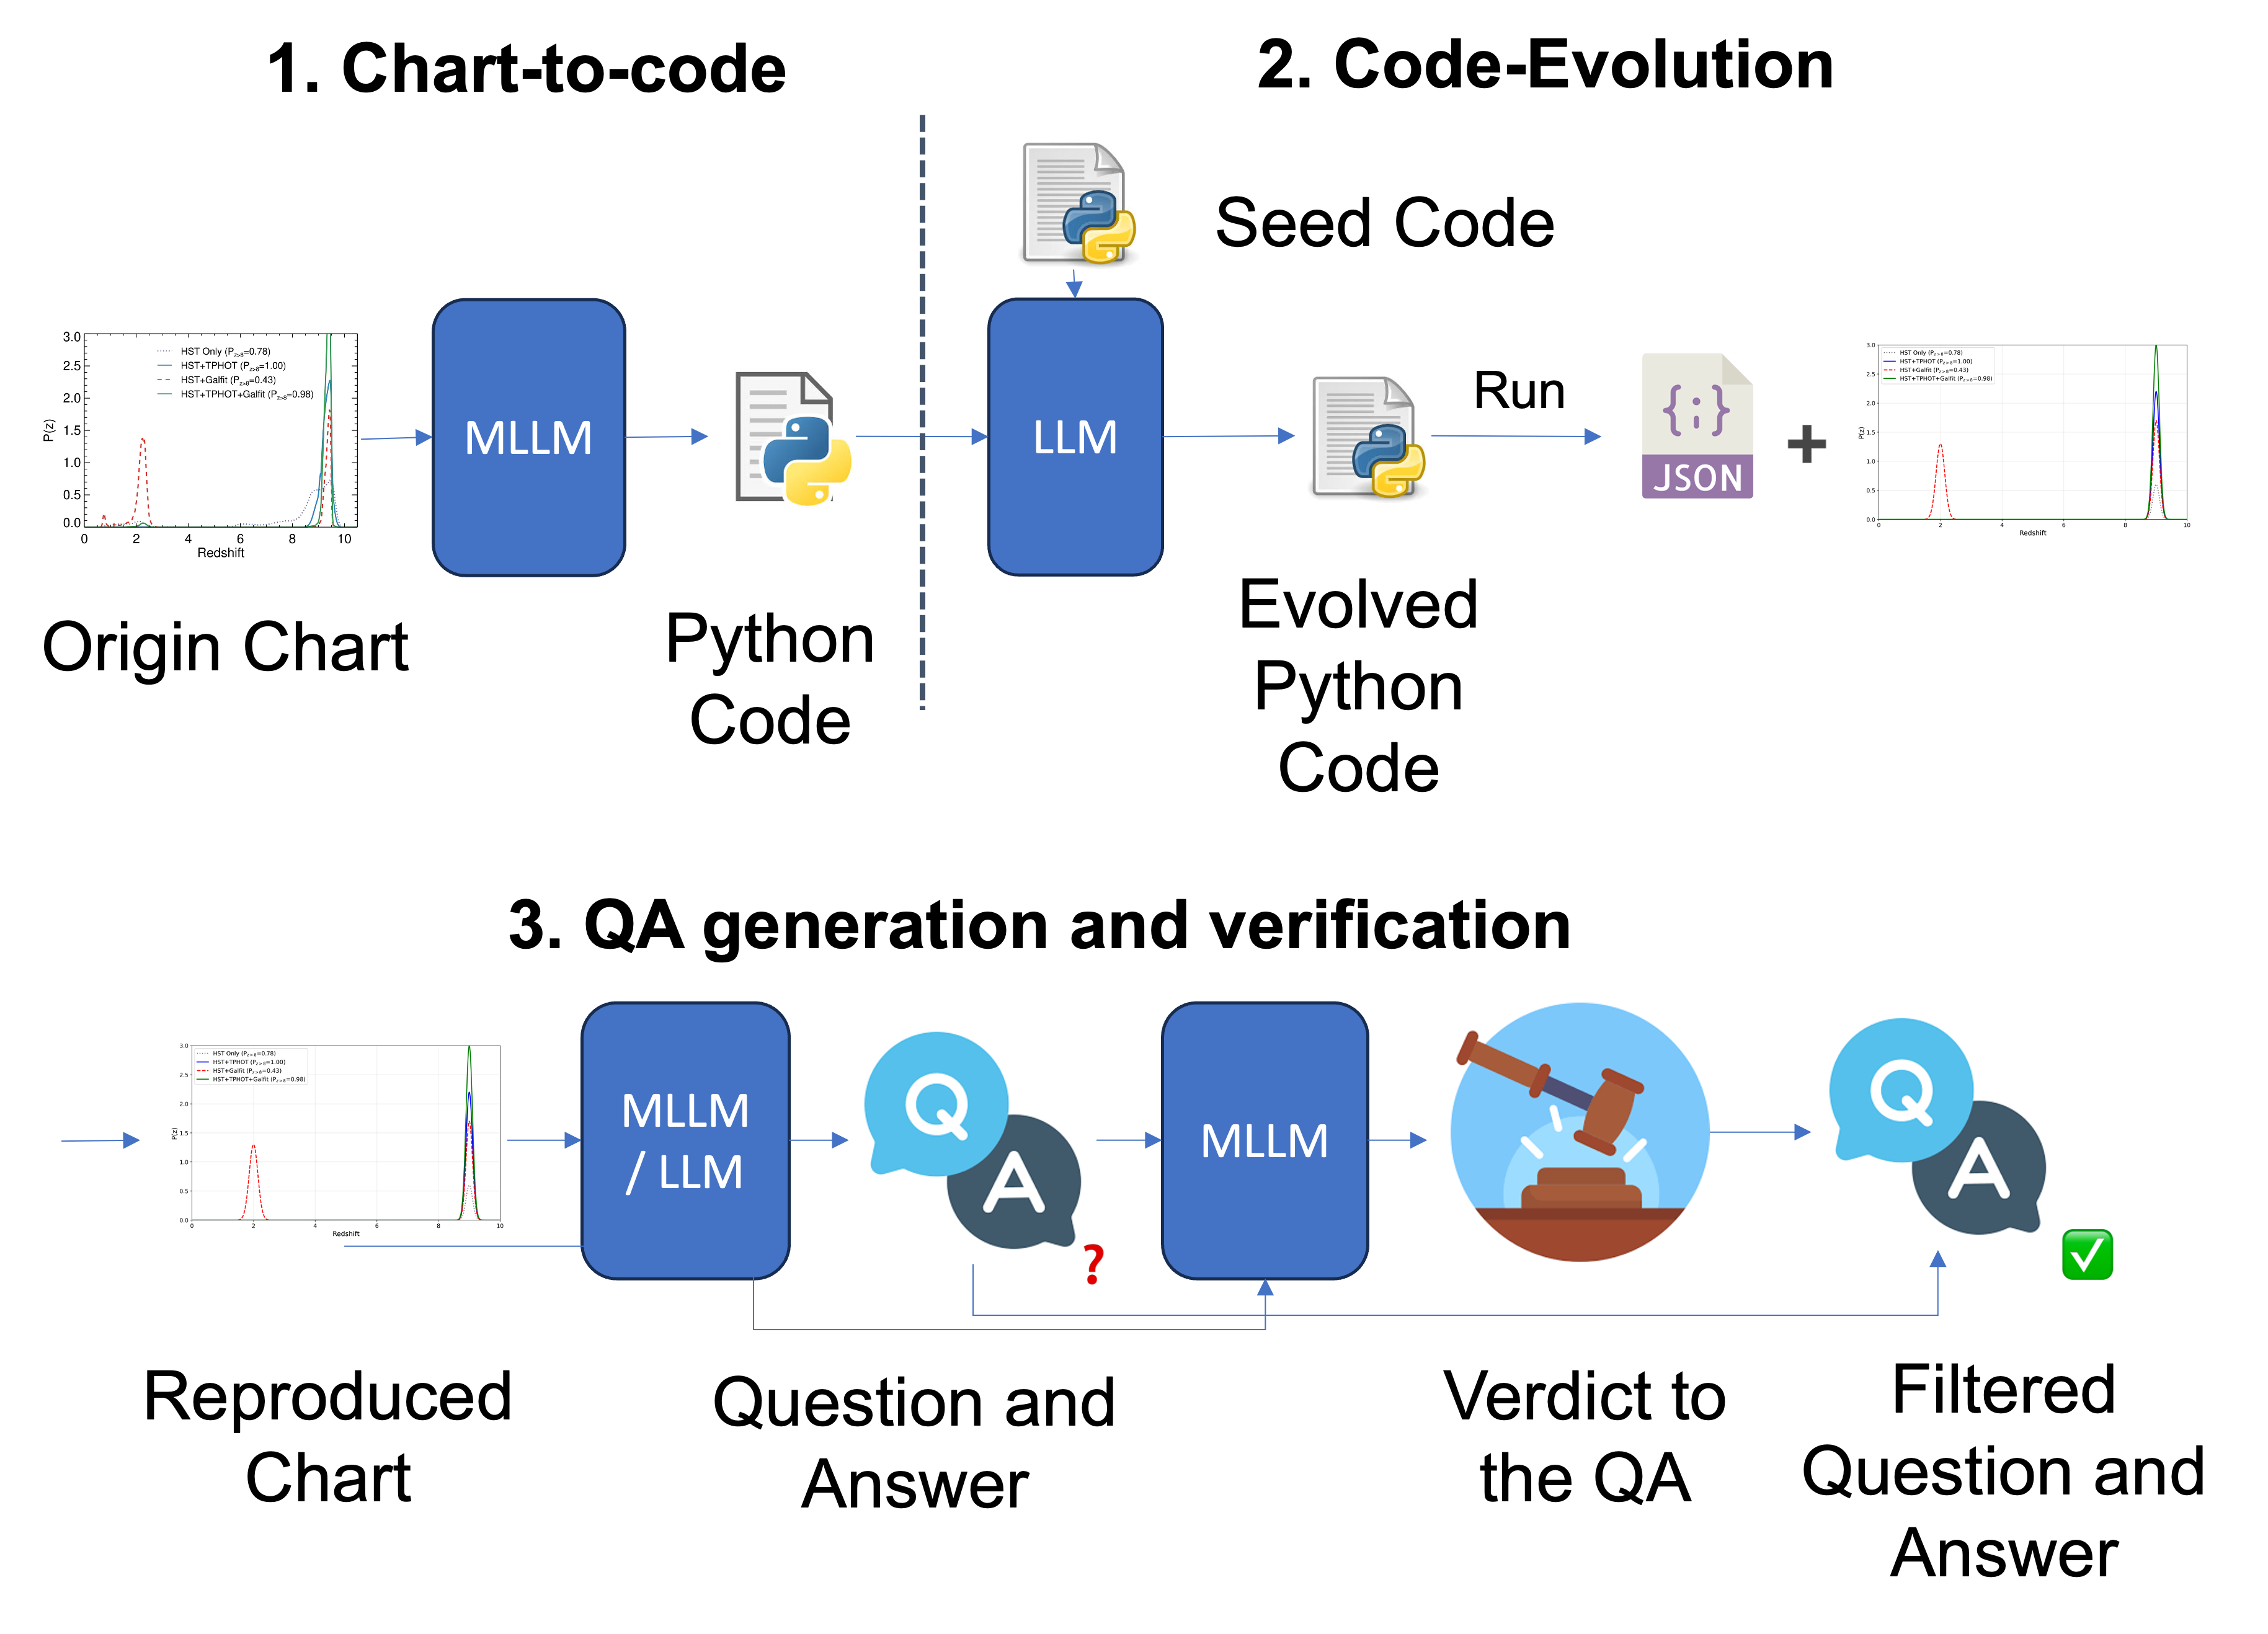
The data-generation pipeline starts from real chart images and reconstructs them as Python code. It then evolves that code to extract chart-element locations during rendering. Together with question-answer pairs, these annotations connect visual layout to the data represented in each chart.

Supervised fine-tuning399,897annotations · 70,652 unique images
Reinforcement learning39,211annotations · 3,979 unique images
START data construction pipeline: translate real chart images into executable code, evolve code to recover chart-element locations, and create spatial and textual training annotations.
From real charts to grounded training data. The paper’s data-generation pipeline recovers code and chart-element locations. Select any figure to inspect it at full size.
1

Reconstruct the chart

Translate a real chart into executable Python, recovering its data representation and visual layout.

2

Recover element locations

Evolve the rendering code to expose positions of visual elements and produce spatial annotations.

3

Build learning examples

Combine chart QA, element grounding, and chart-to-code supervision for SFT and RL.

What is released?

  • Prepared images and annotations for SFT and RL.
  • Generated and evolved Python code for rendering images and extracting element locations.
  • Additional supervision including point and line tasks in the reproduced release.
  • Multi-round agentic SFT conversations using CropRegion, DrawBBox, and DrawLine operations.
SFT annotation composition · public release
Question typeCountShare
Number-in-General145,67636.43%
Chart to code (with QA)111,03227.77%
Text-in-General68,91717.23%
Text-in-Chart27,2626.82%
Number-in-Chart23,2845.82%
Multiple Round Agentic19,7894.95%
Other3,9370.99%

03 / Evaluation resource

CS-Bench

Can a model locate the evidence behind its answer?

The Chart Spatial understanding Benchmark tests a capability that answer-only evaluation does not directly measure: identifying and localizing chart structure. It includes titles, axis labels and ticks, legends, subplots, and inset subplots.

692questions
600unique images
2task families
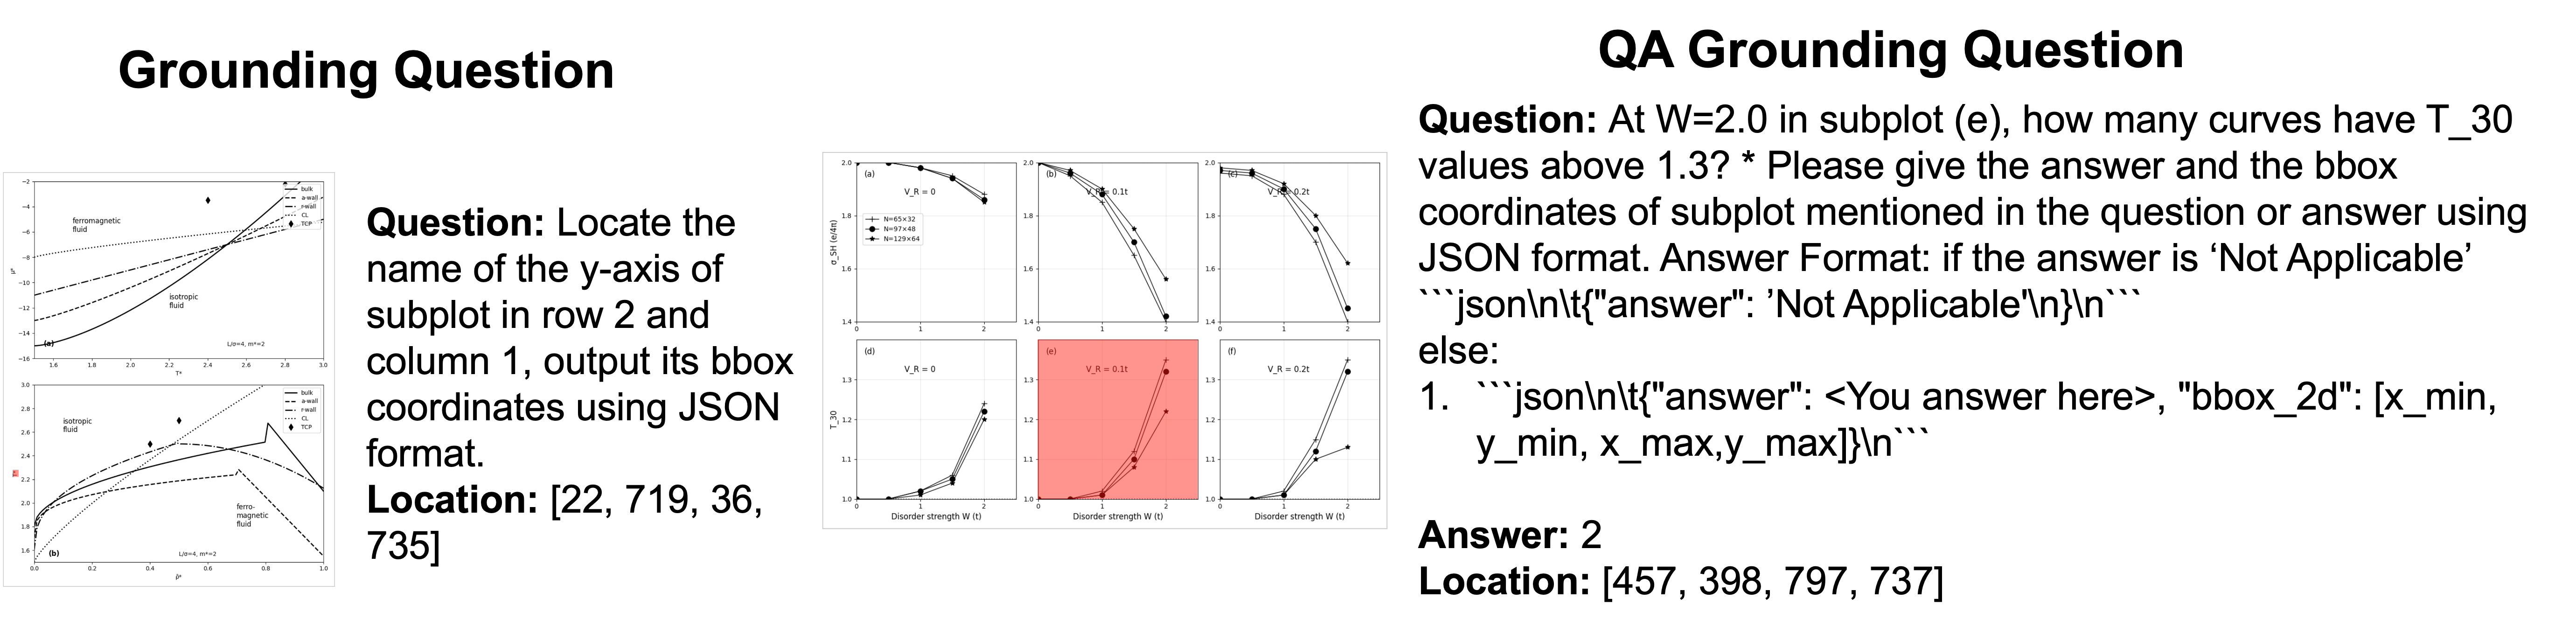
350 questions · 50.58%

Chart-element grounding

Locate a specified visual element and return its bounding-box coordinates.

“Locate the name of the y-axis of subplot in row 1 and column 1, output its bbox coordinates using JSON format.”

Example from the released prediction records.

Evaluates localization
342 questions · 49.42%

QA grounding

Answer a question about a chart element and identify the relevant region. This tests whether the answer is connected to the correct visual structure.

Questions link textual content with its location in the chart, so answer correctness and localization can be assessed separately.

Evaluates answers + localization
Paper examples of CS-Bench questions and chart regions, illustrating chart-element grounding and question answering with spatial grounding.
The paper’s CS-Bench illustration. The statistics above describe the reproduced public release: 692 questions on 600 images.

How is it evaluated?

Recall@0.3 measures localization at an intersection-over-union (IoU) threshold of 0.3. Answer accuracy measures correctness on QA-grounding questions. The provided evaluator also reports Recall@0.5.

Use it in your evaluation

Download the benchmark, run the supplied inference script, and score the model outputs with the repository’s evaluator. Compare against the reported release baselines.

Evaluation instructions

04 / Learning framework

Method Overview

Teach the model to answer, locate, and reconstruct.

START combines chart question answering with two complementary training tasks. The framework studies both supervised fine-tuning and reinforcement learning to strengthen chart understanding.

Spatial learning

Chart-element grounding

Predict the location of the element described by an instruction. Explicit spatial supervision connects language to chart layout.

chart + instruction → coordinates
Textual learning

Chart-to-code generation

Generate executable Python that reconstructs the chart. Code represents data values and how those values are visualized.

chart + instruction → Python
Chart understanding

Question answering

Use both spatial structure and textual details to answer questions about the chart.

chart + question → answer

See Section 3.1 of the paper for the learning objectives and reward design.

05 / Reported release results

Performance

Better spatial grounding, with gains across chart tasks.

The public START-RL-7B checkpoint is initialized from Qwen2.5-VL-7B and trained on the reproduced START dataset. The table below reports the repository’s released checkpoint results, rather than the original paper’s experimental table.

+25.5 pointsCS-Bench Recall@0.3 · 23.1 → 48.6
+14.7 pointsCS-Bench answer accuracy · 50.8 → 65.5
+22.8 pointsChartMimic · 47.1 → 69.9
Reproduced public checkpoint · higher is better
ModelCharXiv
Descriptive
CharXiv
Reasoning
ChartQAProChartMimicCS-Bench
Recall@0.3
CS-Bench
Accuracy
Qwen2.5-VL-7B73.043.241.947.123.150.8
START-RL-7B78.547.647.269.948.665.5

Source: released checkpoint table. Bold marks the better of the two reported scores. Improvements are absolute score differences. Tables scroll horizontally on small screens.

06 / Inside the data

Qualitative Examples

A chart is more than an image and an answer.

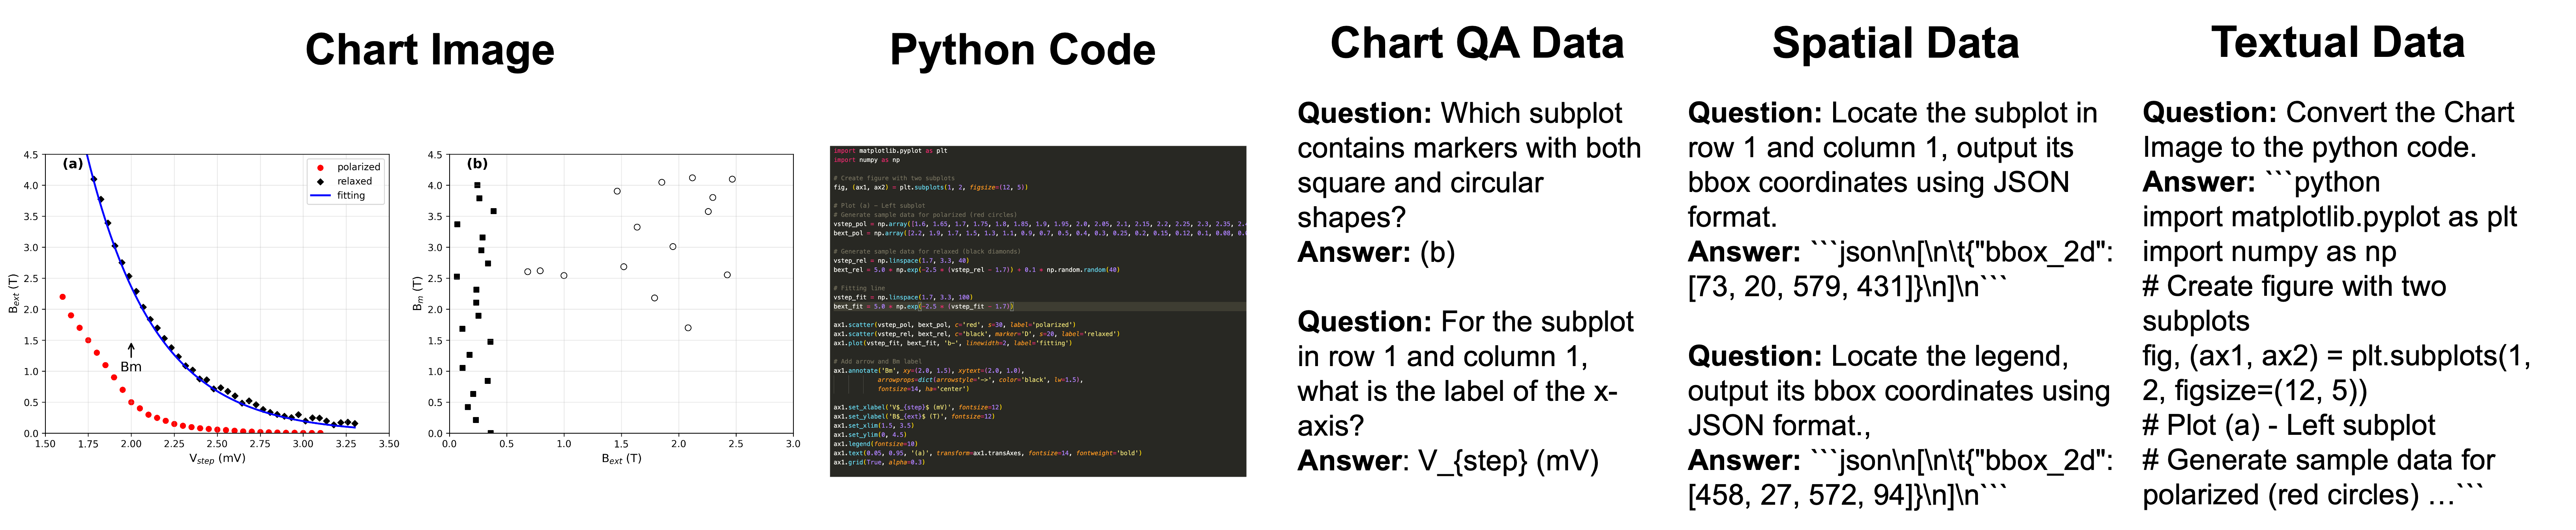
The paper’s dataset illustration shows how one chart can support complementary supervision: recovering Python code, locating visual elements, and answering questions about their content.

START dataset illustration showing a two-panel scientific chart, corresponding Python code, and examples of annotations and dataset statistics from the paper.
Original paper illustration. Any statistics embedded in this figure refer to the paper; the current public-release counts are listed in START-Dataset.

Multi-round visual reasoning in the release

The reproduced SFT dataset also includes conversations in which a chart-analyzing agent requests visual operations before answering. In the example below, it highlights four subplots to compare the direction of their trends.

Question

How many subplots show both lines increasing from All Rp to Rp/Re < 10?

Visual operations

Draw bounding boxes around the Quiescent, Star Forming, AGN, and Composite subplots to inspect both lines.

Reference answer

Only the AGN subplot shows both lines increasing. The final answer is 1.

Condensed from the released SFT conversation example; this is an annotation example, not a live model demo.

07 / Explore & reproduce

Resources

Start with the data. Evaluate with CS-Bench.

08 / Reference

Citation

Please cite START if you use the method, dataset, or benchmark in your research.

BibTeX
@misc{liu2025startspatialtextuallearning,
  title={START: Spatial and Textual Learning for Chart Understanding},
  author={Zhuoming Liu and Xiaofeng Gao and Feiyang Niu and Qiaozi Gao and Liu Liu and Robinson Piramuthu},
  year={2025},
  eprint={2512.07186},
  archivePrefix={arXiv},
  primaryClass={cs.CV},
  url={https://arxiv.org/abs/2512.07186},
}

Contact: Zhuoming Liu